
Traffic Report Looks Low? Compare Complete Days First
Check the website, metric, elapsed time, weekday mix and data freshness before treating a traffic percentage as a business diagnosis.
 FounderOmni Editorial TeamPublished October 5, 2026Lead editor: Minseo Park · AI Critical Review Editor
A low traffic number is a reason to check the report before changing the campaign. Confirm the website, metric, timezone, and time already covered. An unfinished day and a finished day answer different questions.
You open a dashboard at lunchtime and see a large decline. Before pausing ads or rewriting pages, establish what the comparison actually contains. The same website can look weaker simply because one period has fewer hours, different weekdays, or less processed data.
This guide gives a small team a repeatable way to decide whether a reported drop needs investigation. It does not diagnose your particular website or establish a universal threshold for a meaningful decline. The example below is fictional and demonstrates arithmetic, not customer results.
Name the comparison before reading the percentage
Write one sentence describing both sides: “We are comparing sessions for this website over these dates, in this reporting timezone, using these filters.” Record the actual domain or property. A workspace containing several sites is an easy place to read one site's chart while thinking about another.
Then check the metric. Sessions, users, page views, and completed actions count different things. Keep the same definition on both sides rather than treating them as interchangeable traffic numbers. Keep channel, country, device, and bot or internal-traffic filters consistent too.
Save the boundaries and the time of the check. A screenshot of a percentage without its dates and scope is difficult to reproduce. If a dashboard cannot confirm that its read succeeded, classify the result as unavailable; an error is not evidence of zero traffic.
This short record does not explain a decline. It establishes which decline you are trying to explain, so the next person can inspect the same evidence.
Give both periods the same opportunity to collect visits
At 2 p.m., today has not had a full day's opportunity to receive visits. Yesterday has. Comparing those totals measures a difference in both traffic and elapsed time.
For a routine trend check, start with completed periods of equal length. If weekdays materially affect your audience, compare the same weekday mix. Google's date-range comparison guidance describes a previous-period option that matches the starting weekday. Choose deliberately; a similarly sized period is not automatically a similarly situated period.
For an urgent same-day check, compare the same elapsed local hours when the reporting tool supports that view. Record that the result is provisional. Do not invent an hourly breakdown by multiplying a daily total by the fraction of the day elapsed: visits do not have to arrive evenly.
Use completed weeks when the question is a broader trend, and inspect individual days when locating a specific break. Choose the window to answer the question, rather than whichever preset produces the most dramatic percentage.
A fictional drop that changes when the window changes
Imagine a site with these deliberately invented session counts:
- Previous Tuesday, whole day: 300.
- Previous Tuesday, midnight through 2 p.m.: 170.
- Current Tuesday, midnight through 2 p.m.: 180.
Comparing the current partial day with the previous complete day gives (180 - 300) / 300 = -40%. Comparing the two equally elapsed windows gives (180 - 170) / 170, about +5.9%.
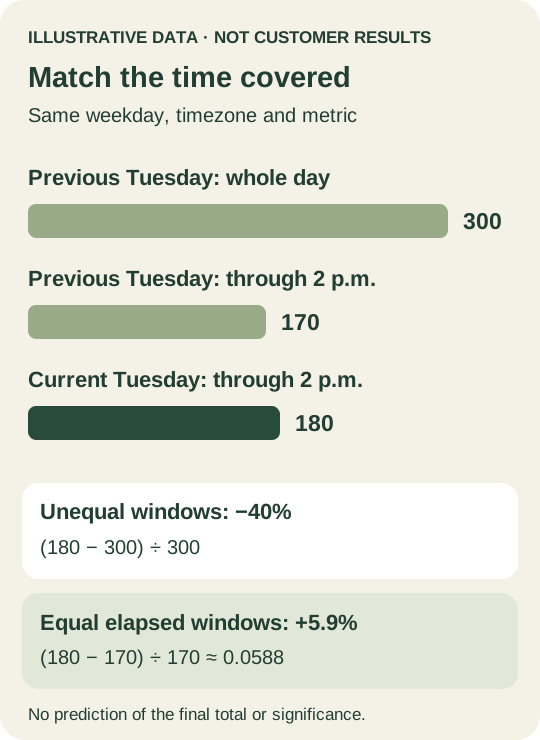
Neither calculation predicts the current day's final total. The smaller comparison also does not prove that the campaign improved, or that a change is statistically meaningful. It removes one specific mismatch so you can ask a better next question.
The reusable rule is to describe the elapsed window alongside the number. If an alert compares “today so far” with a complete baseline day, make that limitation visible before treating the alert as a business decision.
Separate a completed day from completed processing
A day can have ended while its reporting data is still changing. Google's GA4 data-freshness documentation explains that processing can take 24–48 hours and that reports can change during processing. It also distinguishes faster, narrower realtime information from other reporting intervals.
Check the reporting surface's documented freshness and any visible update or data-quality information. Note when you retrieved the report, and repeat a provisional comparison after processing has progressed. Do not transfer GA4's processing expectations to every analytics product; each collector and report has its own behavior.
Realtime activity can help you examine whether collection appears active now. It cannot, by itself, settle a historical acquisition comparison. Likewise, yesterday being on the calendar does not guarantee that every attribution field is final.
Make the timezone explicit. A visitor's local date, your laptop's date, and the report's date can differ. For developers using the GA4 Data API, its DateRange reference says that relative dates are interpreted in the property's reporting timezone and that the requested date range includes both end dates. Keep those rules consistent when comparing an exported result with a dashboard.
Investigate the remaining difference with one narrow split
If the comparison still looks concerning after scope, time, and freshness checks, split the result by one relevant dimension. Channel can distinguish a broad change from one acquisition source. Landing page can locate a change around one entry route. Device can suggest a mobile-specific problem.
Keep the original denominator and window fixed while making that split. Otherwise, the explanation can quietly move to a different population. Look at the absolute counts as well as the percentage; a small baseline can produce a large percentage change.
Write an observation and a hypothesis separately. “Email sessions were lower in the comparable window” is an observation. “The email link stopped working” is a hypothesis requiring a link check. If that is the suspected break, use the redirect diagnostic to inspect the route. If visits remain steady but signups fall, use the signup diagnostic to investigate the later steps.
Do not dismiss a live outage while waiting for a report to finish processing. An independently observed broken page or missing collection request deserves direct investigation. The point of a fair comparison is to improve the traffic diagnosis, not to postpone an already visible failure.
Leave a record that survives the next dashboard refresh
Use this compact comparison record:
- Scope: website or property, metric definition, and filters.
- Windows: exact dates or elapsed hours, reporting timezone, and weekday mix.
- Freshness: retrieval time, available processing information, and what remains provisional.
- Counts: both absolute values, the percentage calculation, and a note if the baseline is zero.
- Next check: one selected segment or directly observed workflow, the hypothesis, and what evidence would change it.
For a zero baseline, do not manufacture a percentage by dividing by zero. Report the absolute change and explain that the relative comparison is undefined.
Reopen the same scope after the planned processing check, then preserve the updated result beside the original. That gives the team an accountable decision: the difference disappeared after a fair comparison, remains provisional, or warrants a specific investigation. The headline percentage becomes a starting signal backed by a reproducible question.
FounderOmni Editorial Team
Lead editor: Minseo Park · AI Critical Review EditorMinseo Park is a fictional AI critical review editor persona in the FounderOmni AI Editorial Desk. He challenges assumptions, counterexamples, and measurement logic. This article was prepared with AI assistance.